Tampilkan postingan dengan label Natural Gas. Tampilkan semua postingan

BP: US oil production growth hit record-high in 2012

Diposting oleh Unknown on Rabu, 19 Juni 2013

by Conglin Xu, OGJ, June 12, 2013

The US recorded the largest single-year increase in oil production in 2012, according to the BP Statistical Review of World Energy. The review, released June 12 [2013], was the company�s 62nd annual report.

Backed by increasing production of unconventional oil and gas, the US recorded the highest growth in both oil and natural gas output in 2012, BP said. Meanwhile, coal consumption in the US experienced the largest decline in 2012 as it was displaced by less-expensive natural gas in electric power generation.

According to BP, world nuclear output recorded the largest annual decline in 2012. After 2011�s Fukushima accident, �higher imports of fossil fuels including [LNG] kept the lights on� in Japan. Due to higher natural gas prices in Europe, power generators substituted coal for gas�an opposite course from the US. [...]

World [primary - D.R.] energy consumption also dropped to 1.8% in 2012, down from 2.4% the previous year, BP reported. The decline was attributable to the economic slowdown as well as improved energy consumption efficiency due to high prices. As the major source of demand growth, emerging countries accounted for 56% of global consumption, up from 42% just 20 years ago.

Global oil consumption increased by 890,000 b/d, 0.9% below the historical average. OECD consumption declined by 1.3% (530,000 b/d) and non-OECD consumption grew by 3.3% (1.4 million b/d).

Global oil production climbed by 1.9 million b/d. Despite a decline in Iranian output due to international sanctions, OPEC contributed to about three quarters of the global increase. [Libyan production recovered strongly after the sharp drop in output in 2011, and Saudi Arabia, the UAE, and Qatar all produced at record levels - D.R.]. Non-OPEC production grew by 490,000 b/d [revised figure 440,000 b/d, according to BP data - D.R.] with increases in the US, Canada, Russia, and China.

BP�s review also stated that world natural gas consumption grew by 2.2%, below the historical average of 2.7%. [Read more]

(Please see BP Statistical Review of World Energy June 2013 - D.R.)
More about → BP: US oil production growth hit record-high in 2012

East Africa Set for Major Gas, Oil Transformation

Diposting oleh Unknown on Kamis, 02 Agustus 2012

By Jacinta Moran in Cape Town; Edited by Jeremy Lovell, Platts, Jul 12, 2012
Oil and gas activity has started rolling in East Africa, as drilling activity ramps up, long-awaited deals are sealed and oil companies scramble to get a slice of what could be an energy goldmine. (see related map: East Africa oil and gas resources) [or right here below
click on map to enlarge -- D.R.]

In Uganda, Tullow Oil has resolved a long-standing dispute with the government for the development of a number of oil-rich blocks, and the UK-listed explorer has also made Kenya's first ever major oil discovery.

Significant gas reserves have been found in Mozambique and Tanzania, where LNG facilities are now been planned. Drilling will kick off in Ethiopia later this year, while Madagascar is believed to hold significant reserves of gas and the Puntland region of Somalia is also showing positive signs. [Read more]

(Also, please see my posts "East African Oil & Gas" and "Third Tanzanian Gas Discovery for Ophir-BG. For gas reserves, please see "Wood Mackenzie: East Africa�s Yet-to-Find Reserves Hold 95 tcf of Gas," OffshoreEnergy Today.com, Aug 22, 2012---Recent discoveries and high profile M&A activity in Mozambique and Tanzania are attracting attention and Martin Kelly, Wood Mackenzie�s Head of Sub-Sahara Upstream Research, says the interest is justified: �100 tcf of gas has been discovered to date in East Africa and we estimate yet-to-find reserves could be as much as 80 tcf in Mozambique and 15 tcf in Tanzania. There is clearly plenty of gas to supply the likely commercialization route of LNG � theoretically enough to support up to 16 LNG trains. �The Rovuma basin is the most prolific in the region, and one of the hottest conventional gas plays in the world, with 85 tcf discovered so far. Globally in 2011, it yielded the third most hydrocarbons, and we expect it to top the list in 2012 if the first half of the year is anything to go by,�Kelly continues. Update:  East Africa may be the new hotspot for explorers but the region will first need to invest in infrastructure to develop and transport the products for domestic and international consumption. The region's regulatory and infrastructure gaps could hinder the transition from gas exploration to production in the medium term, while governments need to be more realistic about timeframes for revenue flows, delegates heard at an industry conference in London on October 2, 2012. [...] Total now expects first commercial oil in Uganda in 2017, a year later than originally expected. The French major entered Uganda's nascent industry early this year after it and China's CNOOC took a third of Tullow's assets for $2.9 billion---please see Jacinta Moran "East Africa Faces Energy Infrastructure Issue," Platts, Oct 4, 2012 -- D.R.)
 

More about → East Africa Set for Major Gas, Oil Transformation

The U.S. Surpassed Russia as World's Leading Producer of Dry Natural Gas in 2009 and 2010

Diposting oleh Unknown on Jumat, 16 Maret 2012

EIA, Today in Energy, Mar 13, 2012
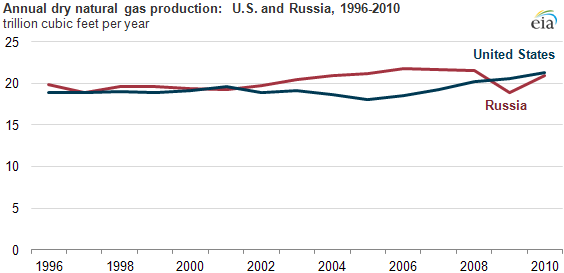
[Click on chart to enlarge]

Source: U.S. Energy Information Administration. Download CSV Data

EIA estimates of annual dry natural gas production indicate that the United States surpassed Russia as the world's leading producer of dry natural gas beginning in 2009 when Russian production dropped in conjunction with the economic downturn and reduced demand (see chart above). Both countries produced more than 20 trillion cubic feet (Tcf) of dry natural gas in 2010. Definitive comparisons of natural gas production trends in the two countries are imprecise due to differences in terminology and reporting methodologies.

Dry natural gas production in the United States rose 18% between 2005 and 2010�mainly due to growth in shale gas production. Increased use of horizontal drilling in conjunction with hydraulic fracturing spurred natural gas supply gains. Other factors contributed to gains in natural gas production: improved site planning and field optimization, multi-well drilling from a single pad, rising associated natural gas production from oil plays, and improved drill-bit technology. According to Lippman Consulting, annual shale natural gas production in key shale plays grew from 1.6 Tcf to 7.2 Tcf between 2007 and 2011 (see chart below).
[Click on chart to enlarge]

Source: U.S. Energy Information Administration, based on Lippman Consulting, Inc.
Note: Lippman Consulting, Inc. gross withdrawal estimates, as of December 2011, converted to dry production estimates with EIA-calculated average gross-to-dry shrinkage factors by state and/or shale play.

Since 1996, Russia's dry natural gas production record has been mixed. It was relatively unchanged between 1996 and 2001, grew to almost 22 Tcf in 2006, and then remained relatively stable before declining in 2009. Two factors leading to this decline were a slow-down in domestic natural gas consumption in Russia and Russian suppliers' cutbacks to match reduced gas needs in Europe. Russian dry natural gas production rebounded somewhat in 2010, although the best available data indicate it remained about 2% lower than U.S. production of natural gas that year. [Full story]

(Also, according to the BP data, in 2010, the U.S. has surpassed Russia as the world's top natural gas producer for the second consecutive year---please see "World's Top 21 Natural Gas Producers, 2005-2010 -- BP." In addition, please see "World's Top 15 Natural Gas Proven Reserve Holders, Jan 1, 2012 -- OGJ." -- D.R.)
More about → The U.S. Surpassed Russia as World's Leading Producer of Dry Natural Gas in 2009 and 2010

[Petroleum Intelligence Weekly Ranks World's Top 50 Oil Companies -- ] Suncor Up, ConocoPhillips Down in PIW`s New Top 50 Oil Rankings

Diposting oleh Unknown on Kamis, 29 Desember 2011


EI/PIW press release via Reuters, Dec 8, 2011

Divestitures and acquisitions were more significant in altering the �Big Oil� leadership landscape than either organic growth or the megamergers of yesteryear, according to the results of Petroleum Intelligence Weekly�s �Top 50� global oil company rankings, released today.

ConocoPhillips� �shrink-to-grow� strategy, which had it spinning off considerable assets in 2010, resulted in the company falling out of the Top 10 for the first time in four years, with the Houston-based giant dropping to 12 from 8 a year earlier.

Conoco�s slippage in 2010 paved the way for Russian Gazprom�s first-time entry into the elite Top 10 that year, moving up to 10 from 12 a year earlier. France�s Total marked the only other shift on the leader board, moving up to 9 from 10 a year earlier [i.e., Saudi Aramco maintained its hold on the top spot, followed by the National Iranian Oil Co. at No. 2; with ExxonMobil at No. 3 and the Petroleos de Venezuela at No. 4. China National Petroleum Corp. retained its spot as the No. 5, followed by U.K.'s BP, Royal Dutch Shell of the Netherlands/UK and Chevron. Please also see the Saudi Aramco website, the HighBeam Business article and my remarks below -- D.R.].     

This year�s rankings reaffirmed the continued importance of the so-called �supermajors� � ExxonMobil, BP, Royal Dutch Shell and Total � which held onto their Top 10 spots. But companies in developing-countries like China were racing to catch up, moving up the ranks as they grew their operations through billions of dollars in strategic acquisitions.

The PIW Top 50 rankings compare petroleum-industry majors, independents and national oil companies based operational size, rather than market cap or other financial measures, to provide a holistic view of the industry landscape. They incorporate six unique operational criteria � oil and gas reserves, oil and gas production, product sales and refinery distillation capacity � from fiscal year 2010, the latest for which complete data were available.

For the first time the Top 50 also took a hard look at M&A, correlating companies� movement in the rankings with the announced deal value of their mergers and acquisitions in 2009, 2010 and year-to-date 2011. The analysis reaffirms M&A�s importance to companies� operational growth strategies, showing large net buyers � particularly in China � have generally fared better than net sellers.

�Companies are increasingly rising or falling based on their ability to look beyond the integrated model to grow their operations,� said Ian Nathan, a senior research analyst at PIW parent company Energy Intelligence Group and lead author of the Top 50. �With new reserves becoming ever scarcer, companies that come up with innovative ways to create value will reap ever bigger rewards.�

Among this year�s PIW Top 50 highlights:
  • The year�s biggest gainer, Canada�s Suncor, soared 10 spots, to 39 from 49, on the strength of its Petro-Canada acquisition and impressive gains in oil and gas production and product sales.
  • Colombia�s Ecopetrol returned to the list, resurfacing at 48 on significant increases in oil output and gas reserves. Meanwhile, New York-based Hess fell out off the Top 50 from 47 as its growth in oil reserves was unable to compensate for a drop in gas reserves.
  • China�s Sinopec and CNOOC each gained four spots, with Sinopec jumping from 26 to 22 and CNOOC from 38 to 34 as they continued executing long-established growth strategies.
  • Gazprom notwithstanding, Russian companies were a mixed bag in terms of growth. Novatek advanced to 41 from 44, but Rosneft, majority owned by the Russian government, fell to 19 from 16.
For a complete list of the Top 50 or to subscribe, please contact us at CustomerService@energyintel.com. [Read more]

(Please see my post "[Energy Intelligence] 'Top 100' Oil Rankings Heavy on Houston Firms,"  by Barrett Goldsmith, Houston Business Journal, Dec 3, 2010. 2011 marks the 23rd consecutive year that Saudi Aramco has achieved the top spot in the PIW rankings. Pemex retained its spot as the No. 11 in PIW's new Top 50 oil rankings for 2010. Also, Petrobras retained its spot as the No. 15 in PIW's new Top 50 oil rankings for 2010. Furthermore, please see Forbes ranking of oil and gas companies by oil and gas production "Mid 2012 Ranking of the World's Biggest Oil & Gas Companies," and PFC Energy ranking of the biggest publicly-traded energy companies, based mainly on capital market performance: "PFC Energy 50 Ranking of World�s Top Energy Companies." -- D.R.)
More about → [Petroleum Intelligence Weekly Ranks World's Top 50 Oil Companies -- ] Suncor Up, ConocoPhillips Down in PIW`s New Top 50 Oil Rankings

Platts Top 250 Global Energy Company Rankings 2011

Diposting oleh Unknown on Rabu, 28 Desember 2011

Platts, Nov 2, 2011
The Platts Top 250 recognizes outstanding financial performance for the previous fiscal year. Each company listed in the Platts Top 250 has distinguished itself through its remarkable performance and the outstanding efforts and dedication of its team. [...]

Top Ten

The entry of German multi-utility E.ON AG to the top ten in 2009� the only non-Integrated Oil and Gas (IOG) company to do so in the last five years�proved fleeting [please see remarks below -- D.R.]. The oil and gas giants reasserted their dominance of the top ten rankings, taking all ten spots despite a stricken BP dropping far from sight. On the back of higher oil prices, the top ten companies brought in a combined $178.874 billion in profits, a 20.4% increase from 2009, but still down from the bumper year of 2008, when profits hit an all-time high of $214.042 billion.

US giant Exxon Mobil Corp retained the top spot in 2010, while Chevron Corp moved up from ninth in 2009 to second place as it boosted its return on invested capital (ROIC) to 16% from 10.2% in the previous year. Gazprom OAO, PetroChina Co Ltd, Total SA and the China Petroleum & Chemical Corp took third, fourth, fifth and eighth places, respectively, while Royal Dutch Shell climbed from tenth to sixth.

Three re-entrants to the top ten in 2010 included ConocoPhillips�now the subject of an innovative demerger into upstream and downstream businesses� which moved up from 24th place to seventh. Meanwhile Russia�s OJSC Rosneft Oil Company and Lukoil Oil Company rose from 14th and 11th places, respectively to take the ninth and tenth spots.

E.ON dropped back to 13th from sixth, and Brazil�s Petrobras-Petroleo Brasilier fell from fourth in 2009 to 12th in 2010. But the biggest omission from the top ten was UK major BP. Ranked second in 2009, BP dropped to 118th on account of the cost of the Macondo oil spill in the US Gulf of Mexico. Although in dollar terms its asset base expanded, as did its revenues, BP�s profits were wiped out. The company posted a loss for 2010 of $3.719 billion.

Here Come the Russians

Although the year-to-year changes in the top ten companies can be small, the big trends can be seen from longerterm comparisons. In 2006, the top ten consisted of five west European integrated oil and gas companies, three US majors, PetroChina and Petrobras. In 2010, there were still three US majors but now two Chinese and three Russian companies, with only two European companies remaining. [...]

The entry of Russian companies into the ranks of the world�s top energy enterprises is a striking feature of the 2010 list, and features not only oil and gas, but also electricity industry companies as a result of privatization in the sector. Of the top ten fastest-growing companies, three are Russian: RusHydro JSC, Bashneft OJSC and Moscow United Electric Grid OJSC, with RusHydro recording a giant three-year CGR of 106.1%. There are now 15 Russian companies in the top 250, compared with 11 in 2009 and nine in 2006.

Mighty Gazprom�s position remains pre-eminent in natural gas, based on its huge production volumes and monopoly grip on Russia�s gas pipelines and exports. However, it may one day have a challenger in the form of private gas company Novatek OAO, which is operator of the planned Yamal LNG project. Novatek has moved up from 126th position in 2009 to 104th in 2010. Profits rose from $854 million to $1,358 million with an impressive ROIC of 19% in 2010�the twelfth-highest ROIC out of the entire top 250. It is also the 34th fastest-growing company based on its three-year CGR. Including AK Transneft OAO, the country�s oil pipeline monopoly, Russia now has eight companies primarily focused on oil in the top 250 as well as two gas and five power sector companies. [...]

Asian Leaders

The number of Asian companies in the top 250 continues to rise, reaching 70 in 2010, up from 67 in 2009 and 56 in 2006. In addition, despite having more companies represented, the average ranking of Asian companies has also improved from 135.2 in 2006 to 134.9 in 2009 and 131.3 in 2010 (a lower number denotes a higher ranking). Asian companies are not just increasing in number, but are increasing their rankings relative to their international peers.

Within Asia, the average ranking of Japanese companies overall has improved from 145.9 to 132.1. This partly reflects the Japan Petroleum Exploration company dropping out of the top 250, but the improvement is notable given the sharp fall in the ranking of the Tokyo Electric Power Co (Tepco) which was ranked 54th in 2009, but 131st in 2010.

This is the result of the financial impact of the Fukushima nuclear disaster in March 2011 and Japanese reporting of financial data based on fiscal years running from April-March. Tepco recorded a loss of $14,881 billion in fiscal 2010. Other Japanese companies dropping down the rankings include Tohoku Electric Power Co, which fell from 119th to 156th and Chugoku Electric Power Co, which dropped from 134th to 178th.

By contrast, Japan�s oil and gas companies performed well. JX Holdings was the shining star, rising from 129th in 2009 to 18th in 2010. Idemitsu Kosan Co Ltd increased its ranking from 144th to 70th. Tokyo Gas Company Ltd upped its place in the list from 108th to 74th. For China, most change was seen within the power sector. The number of Chinese companies in the top 250 was the same in 2010 as in 2009, but the Shenzhen Energy Group, Huadian Power Intl Corp and Shenergy Co. Ltd were displaced by Shanxi Lu�an Environmental Energy Development Co., Shanxi Xishan Coal and Electricity Power Co. and China Longyuan Power Group. In the oil sector, PetroChina moved up from seventh in the rankings to fourth, and CNOOC from 29th to 15th. The biggest mover, however, was China Yangtze Power Co., which jumped from 163rd in 2009 to 112th in 2010.

By contrast, India saw three new companies join the top 250 list�the newlylisted Coal India, oil and gas producer Cairn India Ltd and the IPP company NHPC Ltd. As in Japan, the oil sector also gave India its strongest movers. The Indian Oil Corp Ltd jumped from 78th in 2009 to 42nd in 2010, while the Hindustan Petroleum Corp Ltd rose from 174th to 142nd. [...]

(Please see my post "Platts Top 250 Global Energy Company Rankings 2010." Separately, please watch "Top 250 Energy Company Rankings [2011] analysis: 'Big Oil' dominates, but Asia steals the show," Platts, Nov 2, 2011 and see Platts 2011 rankings for 2010, pdf file. Update: It�s all eyes on China, India and the wider Asia-Pacific region when it comes to rapid financial growth and fast-rising energy companies. Seventy companies from the region were in the spotlight tonight when the 2012 Platts Top 250 Global Energy Company Rankings were unveiled at an awards dinner in Singapore. The 2012 rankings reflect fiscal 2011 financial performance in four key areas: asset value, revenues, profits and return on invested capital/ROIC. ...  In an East-West energy showdown, Western majors still dominated. Western integrated oil and gas/IOG and exploration and production/E&P companies took all of the Top 10 spots on the 2012 list, except for one � ninth place � which went to PetroChina Co. Ltd. ExxonMobil reigned supreme in the number one spot of the Top 250 roster for the eighth consecutive year. Anglo-Dutch major Royal Dutch Shell plc moved up from sixth position to second, displacing U.S. major Chevron to third. ConocoPhillips dropped one place from seventh to eighth. Although French major Total slipped from fifth position to seventh, other European majors saw improvements. Like Shell, Norway�s Statoil also ascended, climbing from 11th place to sixth between the 2011 and 2012 rosters. One of the standout movers among the Top 10 and the overall rankings was BP. The U.K. oil major took fourth position on this year�s list, after having plummeted from second place in 2010 to 118th place last year after more than $38 billion in losses from the Macondo oil spill in the Gulf of Mexico. Other majors, including Russian oil and gas giants, held on to their relatively high global rankings, despite slipping in the standings. Gazprom/Open Joint Stock Company � OJSC Gazprom dropped to fifth place this year from third place, while Rosneft dipped from ninth to 10th. OJSC LUKOIL slipped out of the Top 10 this year to 11th place---please see Platts, press release, Oct 23, 2012. -- D.R.)
More about → Platts Top 250 Global Energy Company Rankings 2011

Angolan Oil Production Has Doubled Since 2003

Diposting oleh Unknown on Sabtu, 15 Oktober 2011

EIA, Today in Energy, Oct 14, 2011

 Source: U.S. Energy Information Administration, Angola Country Analysis Brief & Short-Term Energy Outlook Table 3c: OPEC Crude Oil Production.Download CSV Data [Note: Presumably, crude oil production excluding condensates since the mid-2000s -- D.R.]

Angola has emerged as Africa's second largest oil producer [after Nigeria, and please see remarks below -- D.R.]; its oil production has grown 147% since 2000. Angola is the eighth largest supplier of crude oil to the United States [please see remarks below -- D.R.] and the second largest crude supplier to China, according to data for January through July 2011. Angola is still rebuilding from a 27-year civil war that ended in 2002. Security issues remain, especially in the disputed oil-rich Cabinda exclave. Border disputes have halted some oil developments.

A member of the Organization of the Petroleum Exporting Countries (OPEC), Angola has production targets ranging from 1.52 to 1.66 million barrels per day (bbl/d); however, the country is currently increasing its oil production and capacity. In 2010, Angola produced about 1.85 million bbl/d of crude oil [excluding condensates -- D.R.] and, given very low levels of domestic consumption, exported all but 50 thousand bbl/d.

Oil is crucial to the Angolan economy, accounting for over 95% of export revenues and over 75% of government revenue. In 2010, Angola exported almost 1.8 million bbl/d of crude oil; the majority of crude oil exports went to China (45%) and the United States (23%), representing 17% and 4% of those countries' total crude oil imports, respectively.

Production in 2011 is down, averaging 1.65 million bbl/d, due to temporary technical problems. Industry analysts expect Angolan production to grow beyond 1.85 million bbl/d by the end of 2011, and perhaps reach 2.5 to 3 million bbl/d of capacity by 2016, based on planned project startups.

International oil companies, including Chevron, ExxonMobil, Total, Eni, and BP, play a major role in Angola, operating most production. The Angolan government recently held a licensing round for a pre-selected group of private companies to explore and produce in the country's pre-salt offshore areas�an area believed to be of similar geological makeup to the Brazilian pre-salt.

China is a major investor in Angola and has provided several multi-billion dollar oil-backed loans to fund infrastructure development. The China Petroleum & Chemical Corporation (Sinopec) and China National Offshore Oil Corporation (CNOOC) are among the national oil companies working in Angola. Angola is now the second largest supplier of oil to China, behind Saudi Arabia.

According to EIA's recently released Angola Country Analysis Brief, Angola had 10.9 trillion cubic feet (Tcf) of natural gas reserves in 2011, up from an estimated 2 Tcf in 2007. Natural gas production in Angola is tied directly to oil production and is often vented or flared, with limited volumes consumed domestically. An Angolan liquefied natural gas (LNG) terminal, due to commence operation in 2012, will allow Angola to export its natural gas and reduce flaring. [Full story]

(Please see Aaron and David Rachovich, "Africa's Top 8 Oil Producers, 2006-2010 -- EIA." Angola was in 2009-2010/full year the seventh largest supplier of crude oil to the United States---please see our post "U.S. Crude Oil Imports from Top 15 Countries ... -- EIA." According to Oil and Gas Journal (OGJ), Angola's proved oil reserves stood at 9.5 billion bbl as of Jan 1, 2011---please see our post "World's Top 22 Proven Oil Reserves Holders, Jan 1, 2011 -- OGJ," while BP Statistical Review of World Energy, June 2011, places Angolan proved oil reserves as high as 13.5 billion bbl---please see our post "World's Top 23 Proven Oil Reserves Holders, 2007-2010 -- BP." -- D.R.)
More about → Angolan Oil Production Has Doubled Since 2003

United Kingdom Natural Gas and Oil Production Continues Decade-Long Decline

Diposting oleh Unknown on Selasa, 11 Oktober 2011

EIA, Today in Energy, Sept 21, 2011

 Source: U.S. Energy Information Administration, United Kingdom Country Analysis Brief.Download CSV Data

The United Kingdom (U.K.) is the largest producer of oil and second-largest producer of natural gas in the European Union [after the Netherlands -- D.R.]. Due to steadily declining production since the early 2000s, the U.K. became a net importer of natural gas and oil in 2004 and 2005, respectively.

In 2010, the U.K. produced 1.4 million barrels per day (bbl/d) of oil and consumed 1.6 million bbl/d. [Please see remarks below -- D.R.]. While consumption remained relatively constant throughout the last decade, 2010 production declined 7% from 2009. Further declines are expected: the U.S. Energy Information Administration's Short-Term Energy Outlook predicts the U.K.'s production will fall to 1.2 million bbl/d in 2012. Despite decreasing production, the U.K. remains one of the European Union's leading petroleum exporters; in 2010, the U.K. exported 832,000 bbl/d, more than half of its total production.

Source: U.S. Energy Information Administration, United Kingdom Country Analysis Brief.Download CSV Data

In 2010, U.K. natural gas production was 2.0 trillion cubic feet, a 5% drop from 2009, and the lowest level since 1992. Natural gas consumption rose 7% in 2010. To offset its declining natural gas production in the North Sea, the U.K. is importing more liquefied natural gas (LNG). Deliveries of LNG to the U.K. were up 0.86 billion cubic feet per day, or 54%, during the first nine months of 2011 compared to the same period in 2010.

Because discoveries of new oil and natural gas reserves have not outpaced the maturation of existing oil and natural gas fields, production from both has declined. The U.K.'s increasing reliance on imported natural gas and oil has spurred the government to develop energy policies to focus on enhanced oil and gas recovery, as well as increased cooperation with Norway�U.K.'s largest oil supplier. The U.K. has also invested heavily in renewable energy; according to the U.K. Department of Energy and Climate Change, the U.K. has the largest offshore wind resource in the world.

EIA's United Kingdom Country Analysis Brief features additional analysis of these trends, along with a broad discussion of the U.K.'s energy sector. [Full story]

(Note that oil production refers to the total oil supply, including the production of crude oil, natural gas plant liquids, and other liquids, and refinery processing gain. While oil consumption refers to the total petroleum consumption, including internal consumption, refinery fuel and loss, and bunkering. UK crude oil production, including lease condensate, dropped to 1.2 million bbl/d in 2010, from about 2.7 million bbl/d in 1999. According to Oil and Gas Journal (OGJ), UK's proved oil reserves stood at 2.858 billion bbl as of Jan 1, 2011, a decrease of 7.4% when compared with the Jan 1, 2010. Also, according to OGJ, the UK had 9,040 billion cubic feet (bcf) of proven natural gas reserves as of Jan 1, 2011, a 12% decline from the previous year. -- D.R.)
More about → United Kingdom Natural Gas and Oil Production Continues Decade-Long Decline

Floating Production, Storage Orders Set Record Pace

Diposting oleh Unknown on Sabtu, 06 Agustus 2011

by OGJ editors, OGJ, Houston, Aug 3, 2011
A record pace in the number of floating production and storage orders was noted in a recent study by International Maritime Associates [IMA] Inc., Washington DC. [Please see remarks below -- D.R.]

The study found that the industry has placed a record 14 orders for floating units since March. Currently 256 floating systems are in service or available worldwide, according to the study.

Of these, 62% are floating production, storage, offloading (FPSO) vessels; 17% are production semisubmersibles; 9% are tension leg platforms; 7% are production spars; and the remaining 5% are production barges and floating storage and regasification units (FSRUs).

Eleven of the 256 units are not on a field and are available for reuse.

The 14 orders since March include the world�s first floating LNG vessel. The $3 billion Prelude FLNG [please see remarks and image below -- D.R.] is the most expensive floating production unit ordered to date, the study noted.

Among the other orders, 9 are FPSOs (1 purpose-built unit, 6 units converted from trading tanker hulls, and 2 modification redeployments), 2 production spars, and 2 purpose-built FSRUs. The 14 construction contracts for these units exceed $11 billion, the study said.

Current order backlog includes 53 production floaters, a net increase of 6 units since March. This extends the buildup in backlog that began in second-half 2009, the study noted.

Of the 53 units, 28 have purpose built hulls and 25 have converted tanker hulls. Also 20 are orders from leasing operators, while 33 are orders from field operators.

The study identified 196 projects in the bidding, design, or planning stage that potentially will require floating production or storage. These projects are declared discoveries or planned developments where floating production or storage is an option.

Brazil has the most with 50 potential floater projects in the planning cycle. Next in line is Southeast Asia with 37, followed by West Africa with 36, Northern Europe with 22, Gulf of Mexico with 17, and Australia with 11.

Of the 196 planned projects, 53 are in the bidding or final design stage. Major hardware contracts for these 53 projects are likely to be let within the next 12-18 months, the study noted.

Another 143 floater projects are in the planning or study phase, and major hardware contracts for these are likely to be let in 2013-18, according to the study. [Full story]

(IMA has been producing detailed market reports on floating production for the past 15 years. The reports focus on equipment requirements for floating production projects. They are designed for use in business planning by companies servicing this sector. Three reports are issued during the year -- in March, July and November. For the July 2011 Floating Production Systems Report and for previous reports, please see IMA, here. Floating liquefied natural gas/FLNG is a revolutionary technology that will allow Shell to access offshore gas fields that would otherwise be too costly or difficult to develop. Shell took final investment decision on the Prelude FLNG Project on May 20, 2011. It will start building a FLNG facility to produce and export LNG off the coast of Australia at the site of the gas field. Moored far out to sea, some 200 kilometers from the nearest land in Australia, the FLNG facility will produce gas from offshore fields, and liquefy it onboard by cooling for export at sea. The Prelude FLNG facility will be the largest floating offshore facility in the world. It will be built at Samsung Heavy Industries� Geoje Island shipyards in South Korea---please see "Prelude FLNG - An Overview," and "Shell Decides to Move Forward with Groundbreaking Floating LNG." and "Samsung Says Shell Prelude FLNG Vessel To Cost $3 Billion," as well as my tweets on Twitter dated on May 20 and June 23, 2011, here. Separately, please see my post "BOEMRE Approves First FPSO Use in the U.S. Gulf of Mexico." -- D.R.)
                               Graphic of Shell's Prelude FLNG
                                                                    Source: Shell, here
More about → Floating Production, Storage Orders Set Record Pace

World's Top 21 Natural Gas Producers, 2005-2010 -- BP

Diposting oleh Unknown on Jumat, 10 Juni 2011

by Aaron and David Rachovich


Natural Gas Production* in billion cubic feet (Bcf) per day, 2005-2010


Rank
Country
2010
2010 share of total
2009
2008
2007
2006
2005
1.
United States
59.1
19.1%
56.4
55.1
52.8
50.7
49.5
2.
Russia
57.0
18.4%
51.1
58.1
57.3
57.6
56.1
3.
Canada
15.5
5.0%
15.9
17.0
17.7
18.2
18.1
4.
Iran
13.4
4.3%
12.7
11.2
10.8
10.5
10.0
5.
Qatar
11.3
3.7%
8.6
7.4
6.1
4.9
4.4
6.
Norway
10.3
3.3%
10.0
9.6
8.7
8.5
8.2
7.
China
9.4
3.0%
8.2
7.7
6.7
5.7
4.8
8.
Saudi Arabia
8.1
2.6%
7.6
7.8
7.2
7.1
6.9
9.
Indonesia
7.9
2.6%
7.0
6.7
6.5
6.8
6.9
10.
Algeria
7.8
2.5%
7.7
8.3
8.2
8.2
8.5
11.
Netherlands
6.8
2.2%
6.1
6.4
5.9
6.0
6.1
12.
Malaysia
6.4
2.1%
6.2
6.2
6.2
6.1
5.9
13.
Egypt
5.9
1.9%
6.1
5.7
5.4
5.3
4.1
14.
Uzbekistan
5.7
1.8%
5.8
6.0
5.7
5.3
5.2
15.
United Kingdom
5.5
1.8%
5.8
6.7
7.0
7.7
8.5
16.
Mexico
5.3
1.7%
5.3
5.2
5.2
5.0
4.4
17.
United Arab Emirates
4.9
1.6%
4.7
4.8
4.9
4.7
4.6
18.
India
4.9
1.6%
3.8
2.9
2.9
2.8
2.9
19.
Australia
4.9
1.6%
4.6
4.0
4.0
3.9
3.6
20.
Turkmenistan
4.1
1.3%
3.5
6.4
6.3
5.8
5.5
21.
Trinidad and Tobago
4.1
1.3%
3.9
3.8
3.8
3.5
3.0
Total World
309.0
100.0%
287.9
295.5
285.5
278.7
268.8


*Excluding gas flared or recycled.

Note: Natural gas production data expressed in billion cubic meters (bcm) is also available at www.bp.com/statisticalreview.

Source: BP Statistical Review of World Energy, June 2011, here

(According to the BP data above, in 2010, the U.S. has surpassed Russia as the world's top natural gas producer for the second consecutive year. Also, please see our post "World's Top 22 Natural Gas Proven Reserve Holders," here. -- D.R.)
More about → World's Top 21 Natural Gas Producers, 2005-2010 -- BP